Heat Maps Don't Close Deals: Turning Demand Data Into Territory Decisions
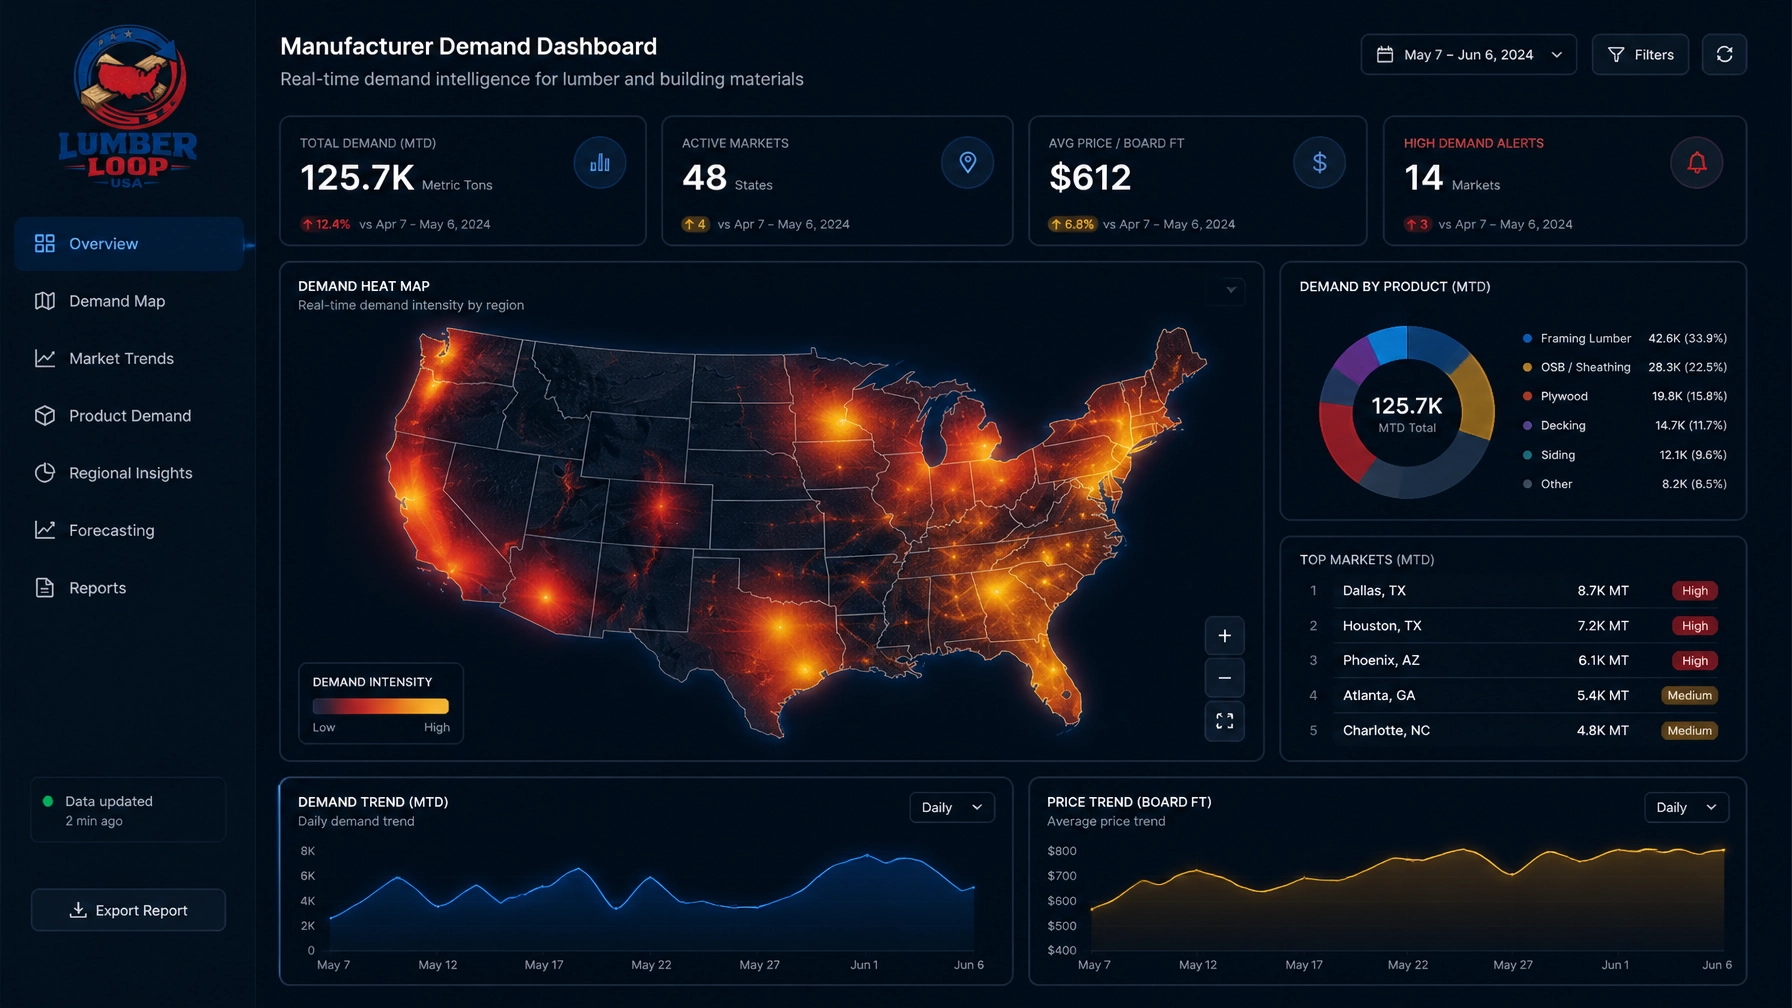
A demand heat map can be one of the most compelling visuals in a manufacturer’s analytics stack.
It can show where product interest is concentrating, which regions are gaining momentum, and where market activity appears to be accelerating. It can give executives a fast view of geographic demand that would be difficult to assemble from disconnected dealer updates, CRM records, and monthly sales reports.
But a heat map does not make a territory decision.
It does not recruit a dealer, move inventory, improve response time, or increase win rates. It shows where attention is needed. The revenue impact comes from what you do next.
For manufacturers, the strategic gap is not always a lack of data. It is the distance between seeing demand and acting on it.
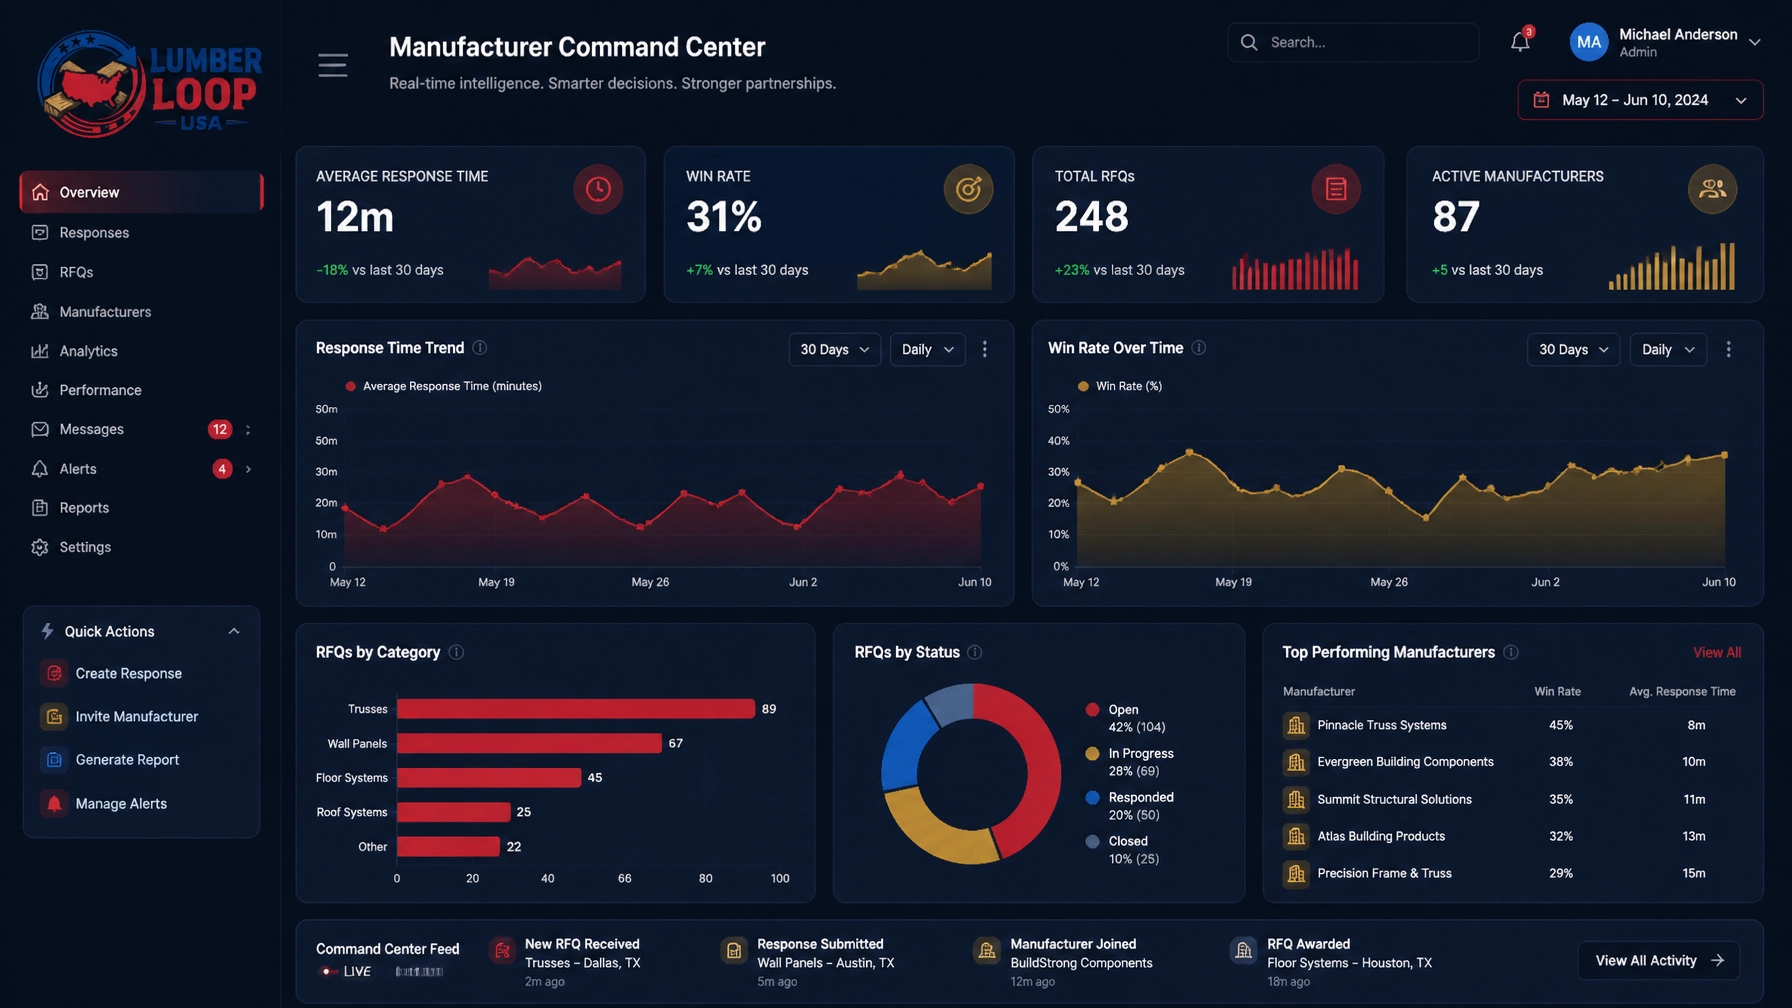
That is why demand intelligence should become more than a picture on an executive dashboard. When paired with dealer performance, response times, win rates, inventory signals, and sell-through data, your demand map can become a territory scoreboard: a shared view of opportunity, accountability, and action.
The Heat Map Is a Signal, Not a Strategy
A high-demand region can mean several different things.
It may indicate strong market potential, successful marketing, a product launch gaining traction, or a concentration of active projects. It may also reveal a channel constraint. If demand is high but dealer responses are slow and win rates are weak, the issue may not be market interest. The issue may be how that interest is being handled.
A low-demand region can be equally difficult to interpret.
It may represent limited category demand. Or it may reflect weak product visibility, insufficient dealer coverage, poor inventory availability, or a lack of local enablement. Without the surrounding performance data, a map encourages assumptions.
A useful territory view should help you distinguish between:
- Demand potential: Where buyer interest is developing
- Channel capacity: Whether your dealer network can serve that interest
- Execution quality: How quickly and effectively opportunities are handled
- Commercial outcome: Whether demand becomes a quote, win, and sell-through
Without those layers, your heat map remains descriptive. It tells you what is happening geographically, but not what decision will change the outcome.
Turn Regional Demand Into Coverage Decisions
One of the clearest uses of demand intelligence is improving dealer network coverage.
Manufacturers often evaluate territories through historical revenue, account lists, or anecdotal feedback from field teams. Those sources remain useful, but they can be backward-looking. Demand intelligence adds a view of current market activity before it appears in shipment or sell-in data.
Your territory analysis should help answer:
- Where is demand increasing faster than current dealer coverage?
- Which regions have strong demand but too few responsive channel partners?
- Where are multiple dealers competing for limited demand?
- Which territories have demand concentration that justifies a new partner?
- Where should coverage be reallocated instead of expanded?
A high-demand, low-coverage territory may warrant dealer recruitment. A high-demand territory with adequate coverage but weak response performance may require dealer enablement or accountability before you add another partner.
That distinction protects you from treating every coverage problem as a coverage expansion problem.
The right decision may be:
- Recruit a dealer in an underserved market
- Add a second dealer for capacity and geographic reach
- Reassign opportunities toward stronger-performing partners
- Establish clearer service expectations
- Consolidate coverage where demand is fragmented and performance is consistently weak
The heat map identifies the territory. Channel analytics determines the intervention.
Pair Demand Density With Dealer Performance
Demand volume alone does not tell you whether the channel is capturing available opportunity.
To evaluate territory health, overlay demand intelligence with dealer-level execution metrics such as:
- Lead response time
- Quote turnaround time
- Response rate
- Quote completion rate
- Win rate
- Lost-opportunity volume
- Substitution activity
- Product availability
- Sell-through by dealer or branch
- Unresolved opportunity volume
This creates a more useful classification system for territory decisions.
High demand, strong execution
These territories may be ready for additional inventory, expanded product lines, or broader dealer coverage. Your priority is to protect momentum and understand what is working.
High demand, weak execution
These territories deserve immediate attention. The market may be present, but the channel is not converting it efficiently. Review response times, dealer capacity, product availability, and competitive substitutions before increasing marketing spend.
Low demand, strong execution
These markets may have limited current opportunity, but strong partners. Consider whether targeted demand creation, product education, or regional marketing could unlock more activity.
Low demand, weak execution
These territories require diagnosis before investment. The issue may be market fit, weak awareness, insufficient coverage, or a dealer relationship that is not producing measurable results.
This framework prevents one of the most common channel mistakes: treating all low-revenue or high-revenue territories as if they have the same underlying cause.

Use Demand Intelligence to Reallocate Inventory
Demand data becomes commercially valuable when it informs product availability.
Manufacturers frequently make inventory decisions using historical orders, forecasts, and distributor requests. Those inputs are important, but they may not capture emerging demand at the speed required for local decisions.
A regional demand view can help you investigate questions such as:
- Is interest rising in a product category before dealer inventory reflects it?
- Are high-demand territories experiencing stock-outs or long lead times?
- Is inventory concentrated in regions with weaker demand?
- Are buyers requesting a product but being directed toward alternatives?
- Does sell-through confirm the demand signal, or is the channel failing to convert it?
The goal is not to move inventory based on a heat map alone. The goal is to combine demand signals with inventory, response, win-rate, and sell-through data so your allocation decisions reflect both opportunity and execution capacity.
For example, strong demand with strong sell-through may support additional inventory. Strong demand with weak sell-through may require investigation first. The constraint could be pricing, dealer follow-up, product knowledge, availability, or substitution.
Demand intelligence tells you where to look. Channel analytics helps you determine what to move and why.
Identify Territories That Need Enablement
Not every underperforming territory needs a new dealer.
Some territories have capable partners that lack the product knowledge, sales tools, or operational process required to convert demand consistently. Others may have strong dealer relationships but weak visibility into open opportunities.
Your enablement strategy should be based on observable performance gaps.
Potential signals include:
- Response times that lag comparable dealers
- Strong demand but low quote completion
- High quote volume but weak win rates
- Frequent substitution away from your product
- Product-specific underperformance despite category demand
- Strong sell-in but weak sell-through
- High unresolved opportunity volume
These signals can guide targeted actions, including:
- Product and application training
- Competitive positioning resources
- Updated quoting guidance
- Inventory planning support
- Dealer-specific opportunity reviews
- Market development funds tied to measurable outcomes
- Escalation processes for high-value opportunities
This is more precise than broad network-wide training. You can direct enablement toward the territories and dealer behaviors most likely to affect revenue.
Make the Map a Scoreboard
A map becomes a scoreboard when it connects opportunity to ownership and outcome.
For each priority territory, define the metrics that indicate whether the channel is improving. These may include:
- Demand volume by product category
- Qualified opportunity volume
- Average dealer response time
- Quote conversion rate
- Win rate
- Substitution rate
- Inventory availability
- Sell-through rate
- Open opportunity aging
- Revenue or volume influenced by the channel
Then assign each territory a decision status, such as:
- Expand: Demand and execution support additional coverage or inventory
- Stabilize: Demand is strong, but channel capacity or performance needs attention
- Enable: Existing partners need focused support to improve conversion
- Investigate: Demand and commercial outcomes do not align
- Monitor: Current opportunity does not justify near-term structural change
This creates a common operating language for sales, marketing, channel, and supply chain leaders.
It also introduces accountability. A territory is no longer simply “hot” or “cold.” It has a measurable opportunity profile, a named owner, and a defined next action.

Connect the Map to Your CRM, Do Not Replace It
Your CRM remains valuable for account management, opportunity records, sales activity, and forecasting. The problem is that it may not capture every demand signal that occurs before a known opportunity enters the pipeline, or every channel event after a lead is handed to a dealer.
Demand intelligence complements the CRM by adding visibility across the wider buyer and channel journey.
Together, the systems can connect:
- Regional demand signals
- Product and category interest
- Dealer referral or handoff
- Response and quote activity
- Opportunity status
- Win or loss outcome
- Inventory and sell-through data
This gives you a more complete view of territory performance without asking your CRM to become a demand-sensing, dealer-accountability, and sell-through platform.
The result is a visibility layer that helps executives understand what the CRM may not show:
- Demand that never became a CRM opportunity
- Opportunities that stalled after dealer handoff
- Regions where interest exceeds channel capacity
- Dealers that receive demand but do not convert it
- Product interest that ends in substitution
- Market potential that is not reflected in current sales
Build an Operating Rhythm Around Decisions
A demand map creates value when it is reviewed as part of a decision process, not displayed as a passive report.
A practical executive operating rhythm may include:
Weekly exception review
Focus on high-demand territories with slow response times, weak win rates, inventory constraints, or aging opportunities.
Monthly dealer performance review
Compare dealer execution against local demand potential, not only against absolute revenue.
Quarterly territory planning
Use demand trends, sell-through, and coverage performance to review recruitment, reallocation, inventory, and enablement priorities.
Campaign and launch analysis
Measure whether regional demand creation produced responsive opportunities and channel outcomes.
This cadence keeps demand intelligence connected to action. It also makes territory planning more objective, because decisions are grounded in current signals and measurable outcomes rather than isolated anecdotes.
Visibility Without Accountability Produces No Revenue Change
A sophisticated heat map can make your organization feel data-driven. But visual sophistication is not the same as commercial impact.
If no one is responsible for responding to a high-demand territory, reallocating coverage, resolving inventory friction, or improving dealer performance, the map will not change revenue.
The strategic value comes from connecting four elements:
- Signal: Where demand is emerging
- Context: What dealer and market conditions surround it
- Decision: What should change
- Accountability: Who owns the next action and outcome
That is how you move from demand visualization to demand intelligence.
Lumber Loop helps manufacturers connect regional demand with dealer response times, win rates, opportunity tracking, and channel performance. The result is a clearer view of where demand is being captured, where it is being lost, and which territory decisions can improve market share.
Learn more about demand intelligence for manufacturers.
Find Your Lead Leakage Before You Expand Coverage
Before recruiting another dealer or increasing regional marketing spend, identify where demand is already being lost across your channel.
The Free Lead Leakage Scorecard helps you evaluate the visibility gaps between demand creation, dealer handoff, opportunity tracking, and channel outcome.
Get the Free Lead Leakage Scorecard
You do not need another heat map that only shows where interest exists. You need the intelligence to decide what to do about it.
Get matched with local dealers in minutes.
Submit your material needs and ZIP — we'll route to the closest qualified dealers in your market.
Request a QuoteMore insights

Anonymous Demand: The Buyers Shopping Your Catalog Who Never Reach Your CRM
Lead Leakage Is Costing You More Than You Think: Why a CRM Alone Cannot See the Full Buyer Journey