Win-Rate Analytics for Manufacturers: Finding the Dealers Who Actually Close Your Demand
A dealer locator is often treated as a finished marketing asset. A buyer visits your website, finds a nearby dealer, and receives a path to purchase.
From your perspective, the journey appears complete.
But the most important part of the journey may be the part you cannot see: what happens after the referral.
Did the dealer respond? Was the requested product quoted? Did the opportunity become a sale? Was the buyer offered a competing product instead? Did the opportunity disappear because the dealer lacked inventory, followed up too slowly, or failed to prioritize the request?
If you cannot answer those questions, your dealer locator may be costing you more than its development and maintenance expense. It may be creating demand that your organization cannot measure, manage, or reliably convert.
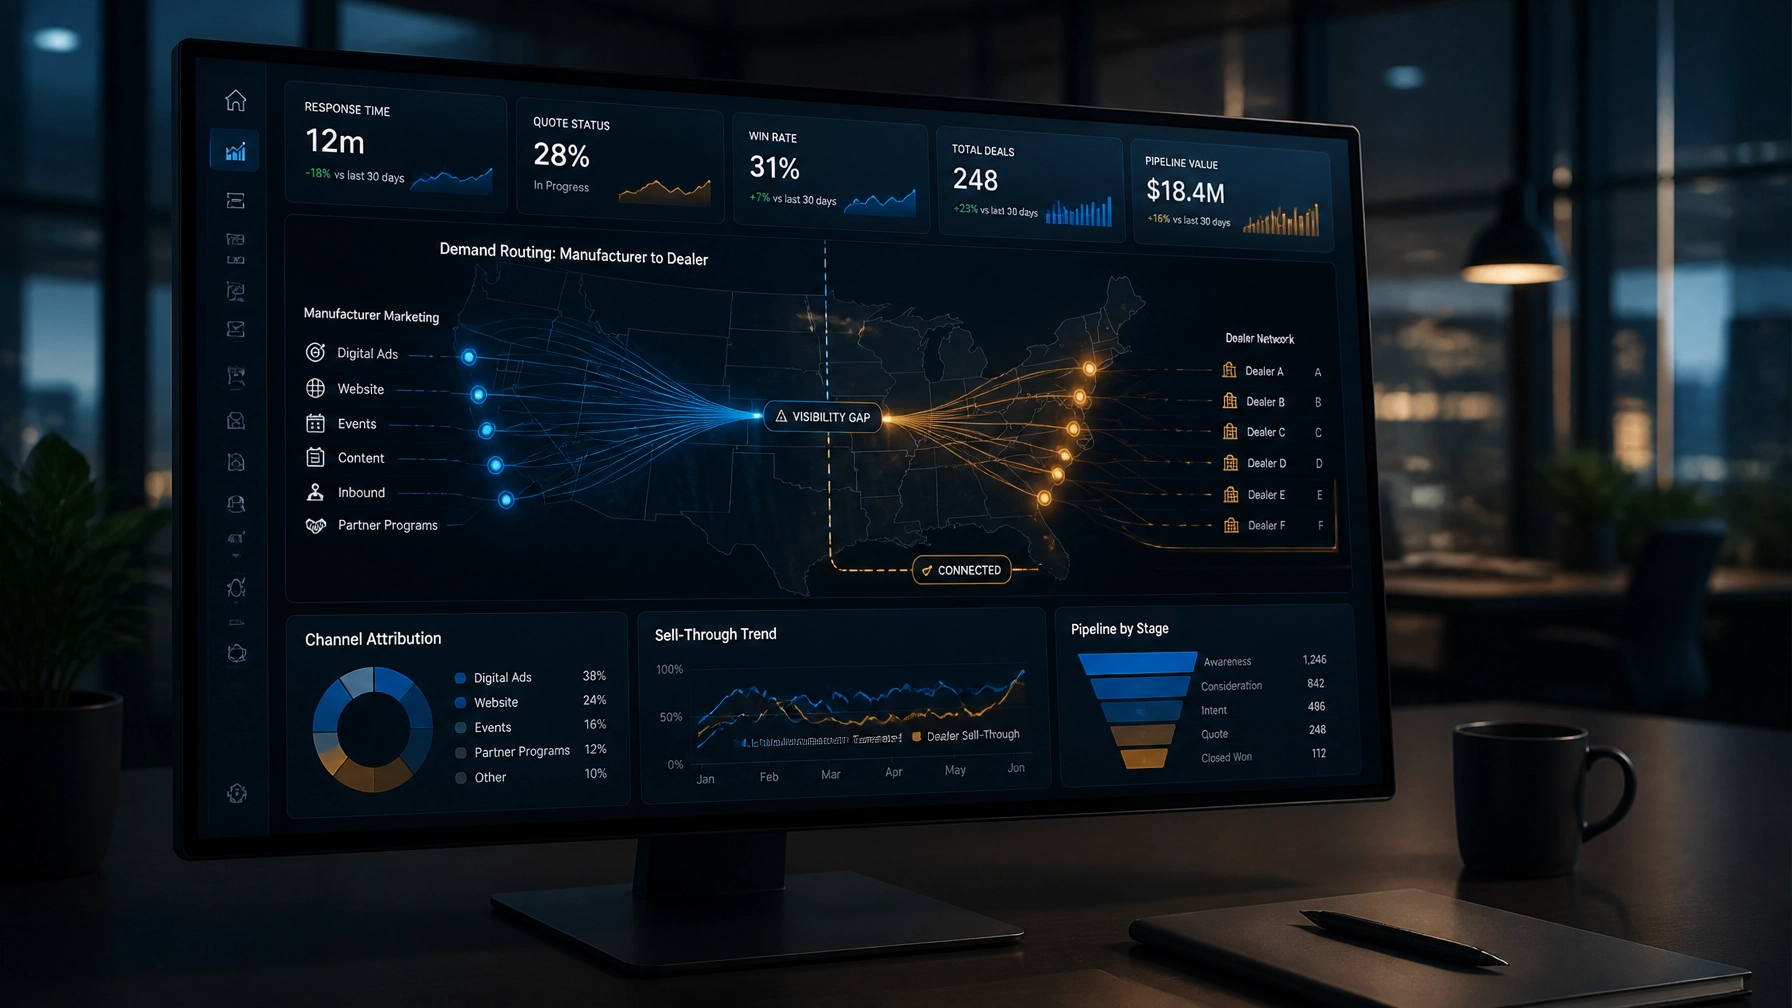
This is the hidden cost of the dealer handoff. As discussed in The Hidden Cost of the Dealer Handoff, visibility often ends precisely when manufacturer-generated demand enters the channel.
Win-rate analytics gives you a way to see what happens next.
A Dealer Referral Is Not a Closed Opportunity
A dealer locator measures access. It does not necessarily measure performance.
Sending a buyer to a dealer does not confirm that the dealer:
- Received the opportunity
- Responded within an acceptable time
- Had the requested product available
- Provided a quote
- Represented your product accurately
- Followed up consistently
- Won the opportunity
- Recorded the transaction in a way you can attribute
Without this information, you may overestimate the value of your dealer network. A high referral volume can look positive while the underlying conversion rate remains weak.
That creates several risks for manufacturers:
- Marketing investment produces activity but not measurable revenue
- Sales teams cannot distinguish strong dealers from weak performers
- Channel leaders rely on anecdotal feedback instead of opportunity data
- Product demand is mistaken for product sales
- Lost opportunities remain invisible
- Competitor substitutions go unreported
- Market share gaps are identified too late
The problem is not that dealer locators are ineffective. The problem is treating a locator as the end of the customer journey instead of the beginning of a measurable channel process.
What Win-Rate Analytics Shows You
Win-rate analytics connects manufacturer-generated demand to dealer execution and commercial outcomes.
At the most basic level:
Win rate = won opportunities ÷ total closed opportunities
But a useful manufacturer analytics model goes beyond one percentage. It shows how opportunities move through the funnel and where performance changes by dealer, market, product category, and demand source.
You should be able to evaluate:
- Demand volume by geography and product category
- Dealer response time
- Contact and quote completion rates
- Opportunity aging
- Quote win rates
- Lost and abandoned opportunities
- Product substitutions
- Inventory-related losses
- Sell-through by dealer or branch
- Campaign-to-opportunity performance
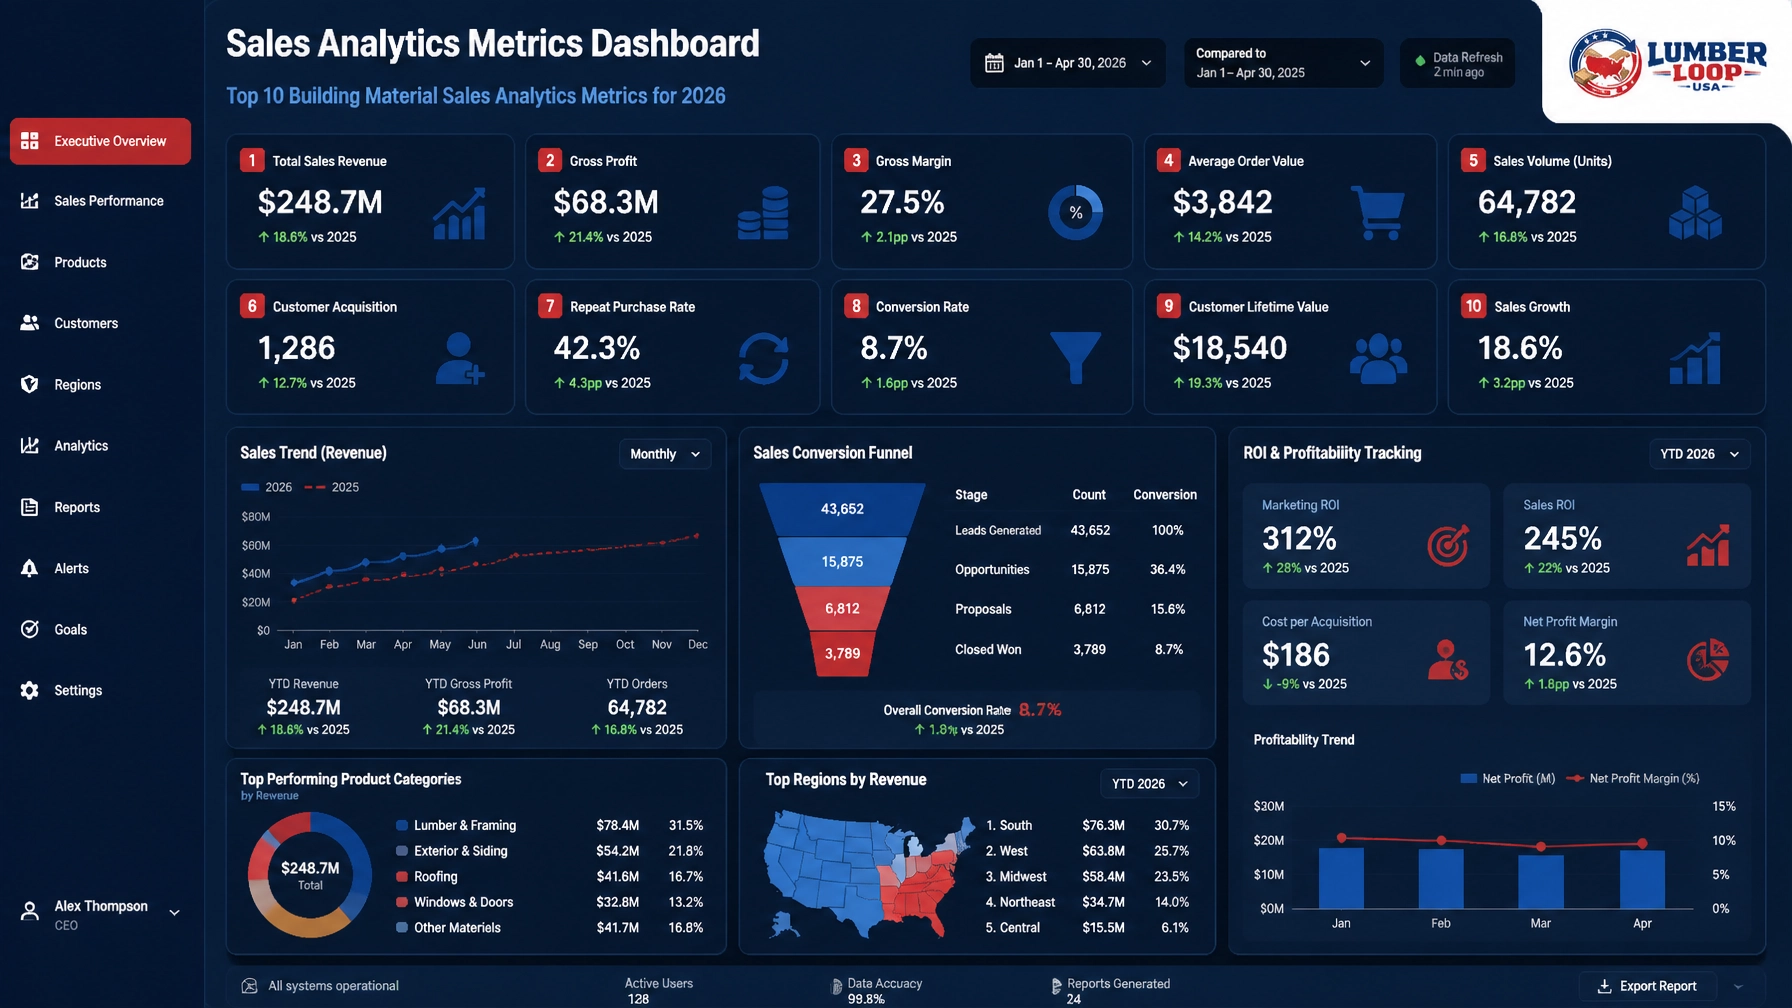
- Opportunity-to-revenue attribution

This allows you to separate demand creation from demand conversion.
A dealer may receive a high volume of opportunities but close very few. Another dealer may receive fewer opportunities and produce a significantly higher win rate. Looking only at referral volume hides that difference.
Win-rate analytics makes it visible.
Not Every Dealer Converts Your Demand Equally
Dealer networks are rarely uniform. Partners vary in staffing, product knowledge, inventory position, response discipline, quoting practices, and local market strength.
That variation directly affects the return on your demand-generation investment.
Two dealers may receive similar opportunities, but their outcomes may be very different:
- Dealer A responds quickly, quotes the requested product, and closes a high percentage of opportunities.
- Dealer B responds inconsistently, substitutes products frequently, and leaves a large share of opportunities unresolved.
If both dealers appear as equal locations in a traditional locator, you have no way to see the revenue difference created by their execution.
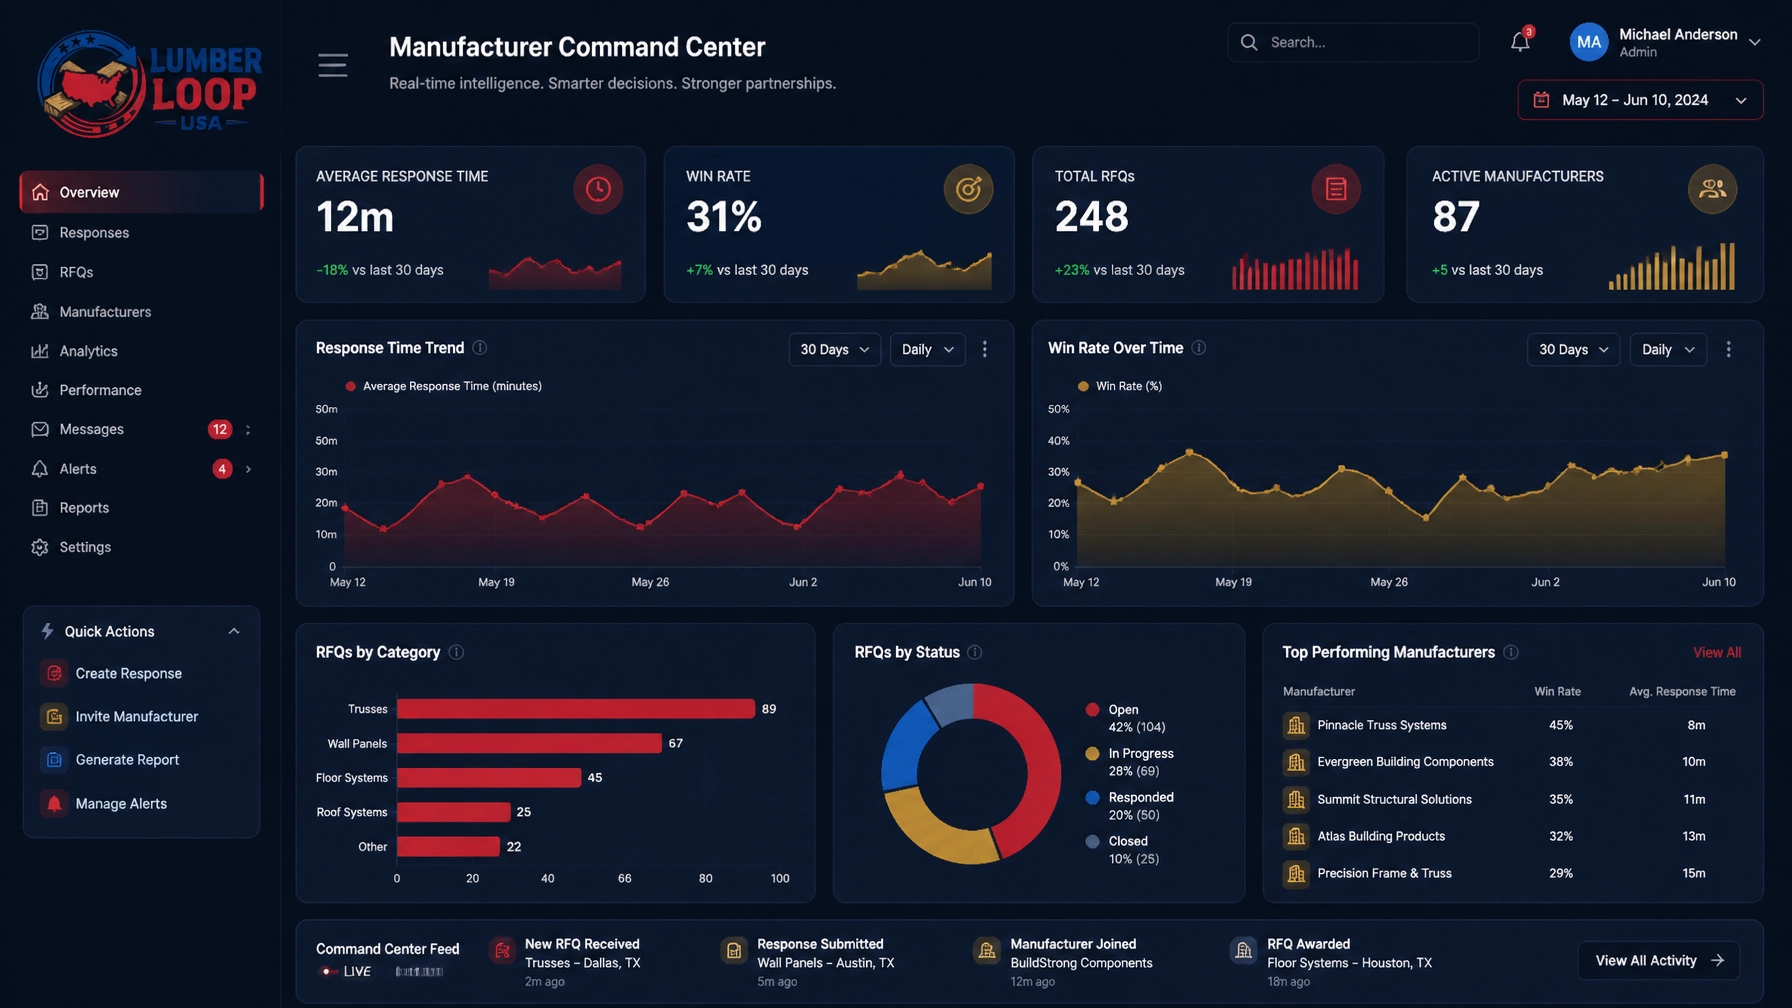
A stronger dealer performance model compares partners using both leading and lagging indicators.
Leading indicators
- Average response time
- Response rate
- Quote completion rate
- Opportunity aging
- Product availability
- Follow-up activity
- Demand coverage by territory
Outcome indicators
- Opportunity win rate
- Lost opportunity volume
- Substitution rate
- Sell-through
- Product mix
- Regional revenue contribution
- Conversion by demand source
This information helps you identify which dealers are prepared to close the demand you create and which partners may require enablement, inventory support, routing changes, or closer performance management.
Find Where Demand Leaks
A low win rate does not always mean the market lacks interest in your product.
Demand may be leaking at several points in the channel:
Slow response
High-intent opportunities lose value when they sit without action. Tracking response times by dealer and region helps you identify where demand is not being addressed quickly enough.
Incomplete quoting
A referral may be received but never become a formal quote. This can signal workflow issues, product availability problems, or a lack of dealer engagement.
Product substitution
If a buyer requests your product but receives a competing alternative, the opportunity may be recorded as a dealer sale while your brand loses the transaction. Without product-level outcome tracking, that loss is difficult to identify.
Inventory mismatch
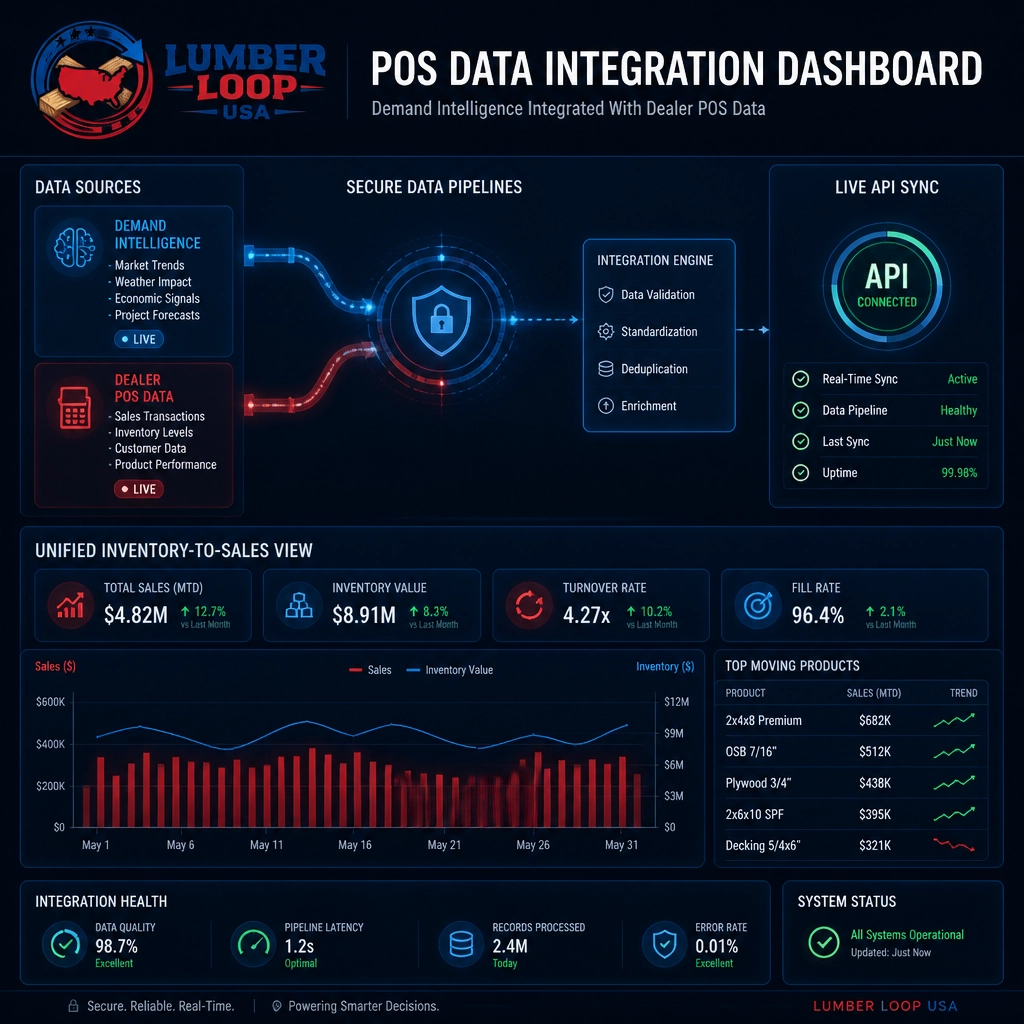
Strong demand with weak sell-through may point to availability problems rather than weak market potential. Connecting demand intelligence with inventory and POS data helps you distinguish those conditions.
Unresolved opportunities
An opportunity marked neither won nor lost provides little strategic value. Standardized status tracking gives you a clearer view of the pipeline and exposes demand that may be disappearing without explanation.
These are not simply dealer-management issues. They affect marketing ROI, production planning, regional expansion, and market-share strategy.
Measure Dealer Performance Against Market Potential
Dealer rankings based only on revenue can be misleading.
A dealer in a large, high-demand market may generate more revenue than a dealer in a smaller market while converting a lower percentage of available opportunities. To understand true performance, you need to compare dealer results with the demand potential in the market they serve.
Useful comparisons include:
- Demand volume versus closed sales
- Regional opportunity versus dealer win rate
- Product interest versus product sell-through
- Dealer response time versus opportunity value
- Market potential versus captured revenue
- Referral volume versus quote completion
- Campaign activity versus dealer-level conversion
This gives you a more strategic view of dealer performance.
You can identify high-performing dealers that deserve greater opportunity volume, underperforming dealers that need targeted support, and markets where demand is strong but channel execution is limiting growth.
Connect Win Rates to Marketing ROI
Marketing leaders are often asked to prove the revenue impact of campaigns, product launches, content, paid media, and digital experiences.
That becomes difficult when measurement stops at a website visit or dealer-locator click.
A more complete attribution path connects:
- Demand source : campaign, product page, specification content, or other digital interaction
- Product intent : product family, application, quantity, or requested specification
- Market : ZIP code, territory, region, or branch
- Dealer routing : partner that received the opportunity
- Dealer activity : response, quote, follow-up, and opportunity age
- Outcome : won, lost, substituted, abandoned, or unresolved
- Sell-through : POS transaction, order, or other validated channel result

With this framework, you can answer questions that a traditional dealer locator cannot:
- Which campaigns generate opportunities dealers actually close?
- Which dealers produce the highest win rates for your products?
- Which regions have strong demand but weak conversion?
- Where are buyers being lost to substitutions?
- Which product categories have high interest but low sell-through?
- Which markets justify additional channel investment?
- Where should marketing spend be increased, reduced, or redirected?
The goal is not to assume every opportunity will become a sale. The goal is to identify preventable leakage and make resource allocation more precise.
Turn Dealer Data Into Channel Action
Win-rate analytics is valuable when it changes decisions.
Your sales and channel teams can use the data to:
- Route more opportunities toward dealers with strong response and close rates
- Create targeted enablement programs for underperforming partners
- Identify inventory gaps before they affect conversion
- Improve product education where substitution rates are high
- Adjust dealer coverage in high-demand markets
- Recognize partners that consistently deliver strong outcomes
- Compare performance across product categories and regions
- Build more credible marketing ROI reports
This creates a more productive conversation with your dealer network. Instead of relying only on shipment data or periodic updates, you can review shared evidence about demand, response, conversion, and sell-through.
The result is better accountability without treating every dealer or market as identical.
The Dealer Locator Cost You May Not See
The cost of a dealer locator is not limited to software fees, maintenance, or development.
The larger cost may be the demand it creates without helping you measure what happens afterward.
When referrals disappear into the channel, you lose more than visibility. You may also lose:
- Revenue attribution
- Marketing confidence
- Dealer performance intelligence
- Product-level demand signals
- Competitive insight
- Opportunities to grow market share
A dealer locator tells buyers where to go. Win-rate analytics tells you whether the channel is converting the demand you created.
That distinction matters.
Lumber Loop helps manufacturers connect demand intelligence, dealer routing, response activity, opportunity tracking, and channel performance in one measurable system. You can learn more about the manufacturer-focused platform on the Lumber Loop manufacturers page.
You can also continue the series with How to Integrate Demand Intelligence With Your Existing Dealer POS Data and Spec-to-Sale Attribution: How Manufacturers Can Finally Prove Marketing’s Impact.
Find the Dealers Who Actually Close Your Demand
The most important question is not how many buyers used your dealer locator.
It is how many opportunities were answered, quoted, won, lost, substituted, or left unresolved.
Once you can see those outcomes, dealer performance becomes measurable. Demand leakage becomes identifiable. Marketing ROI becomes more credible. And your channel strategy can focus on the partners and markets with the greatest potential to grow.
Get matched with local dealers in minutes.
Submit your material needs and ZIP — we'll route to the closest qualified dealers in your market.
Request a Quote