How to Integrate Demand Intelligence With Your Existing Dealer POS Data
A dealer locator can look like a complete demand-capture strategy.
A buyer searches for a nearby partner, selects a dealer, and receives a path to purchase. From the manufacturer’s perspective, the journey appears to be working.
But what happens after the handoff?
Was the inquiry answered? Did the dealer provide a quote? Was your product available? Did the buyer choose a substitute? Did the opportunity become a sale, or disappear without a trace?
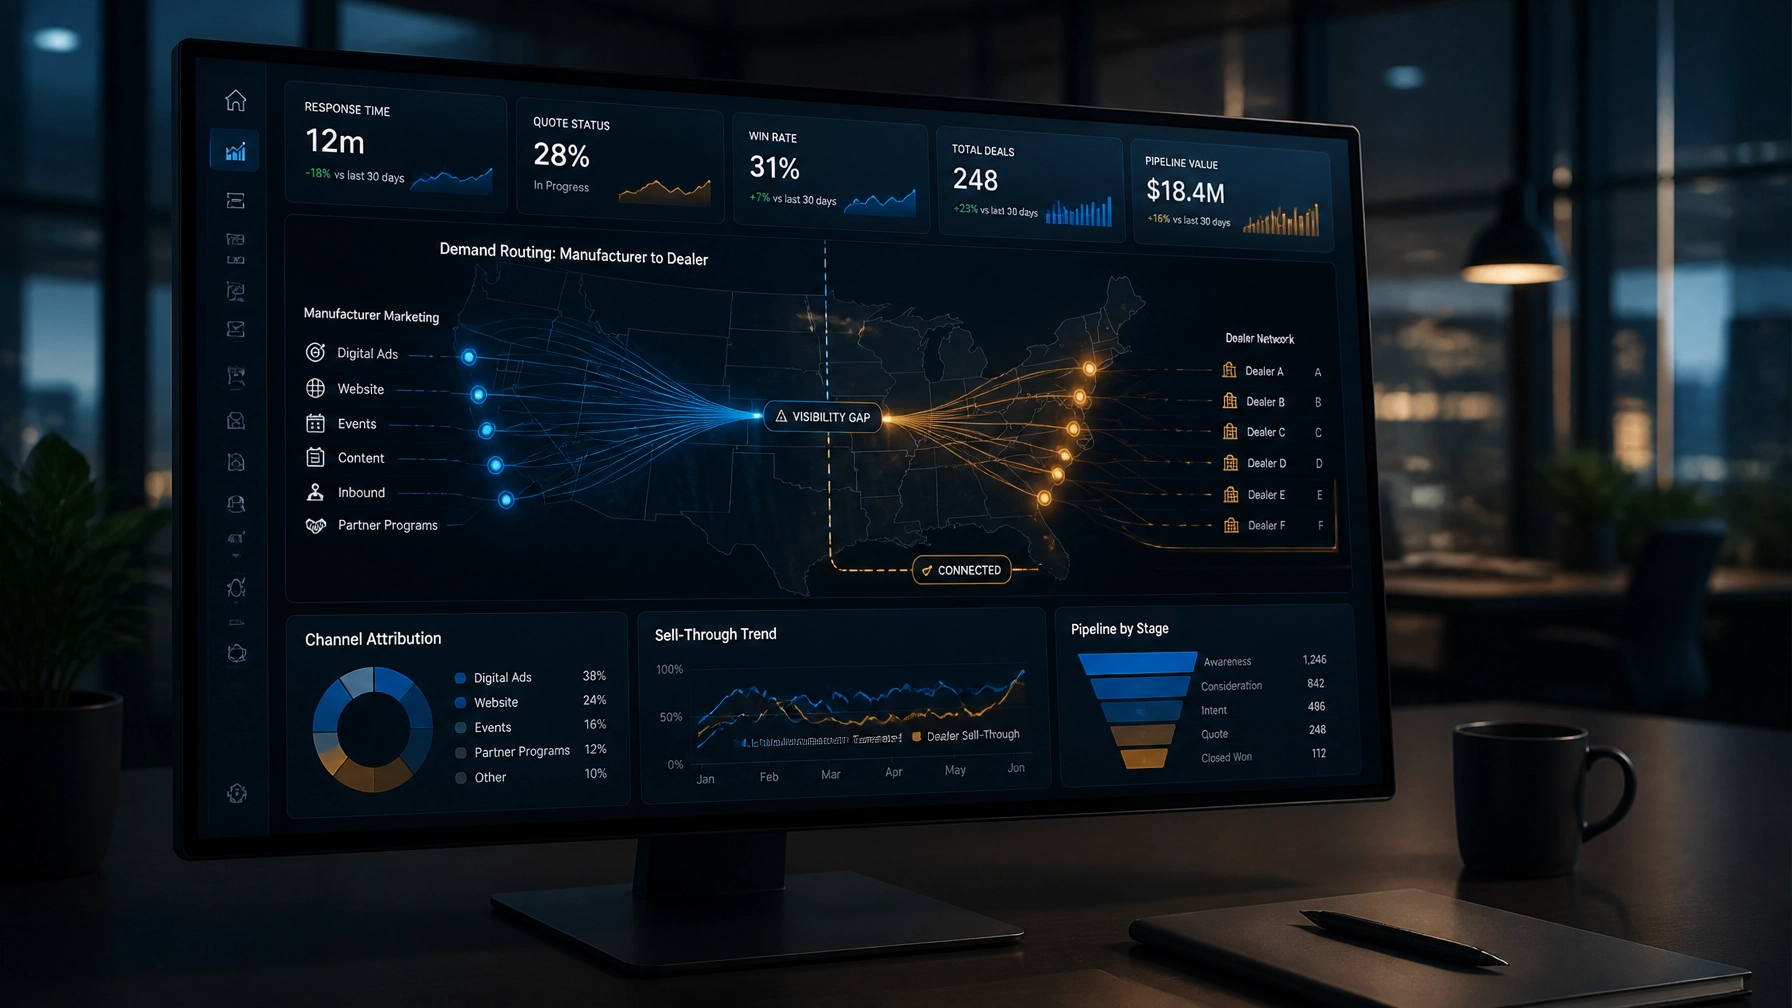
If your dealer locator cannot answer those questions, it may be creating a costly visibility gap. Not because dealer locators are inherently ineffective, but because a static dealer locator often ends the manufacturer’s view of the customer journey at the exact moment valuable demand is transferred to the channel.
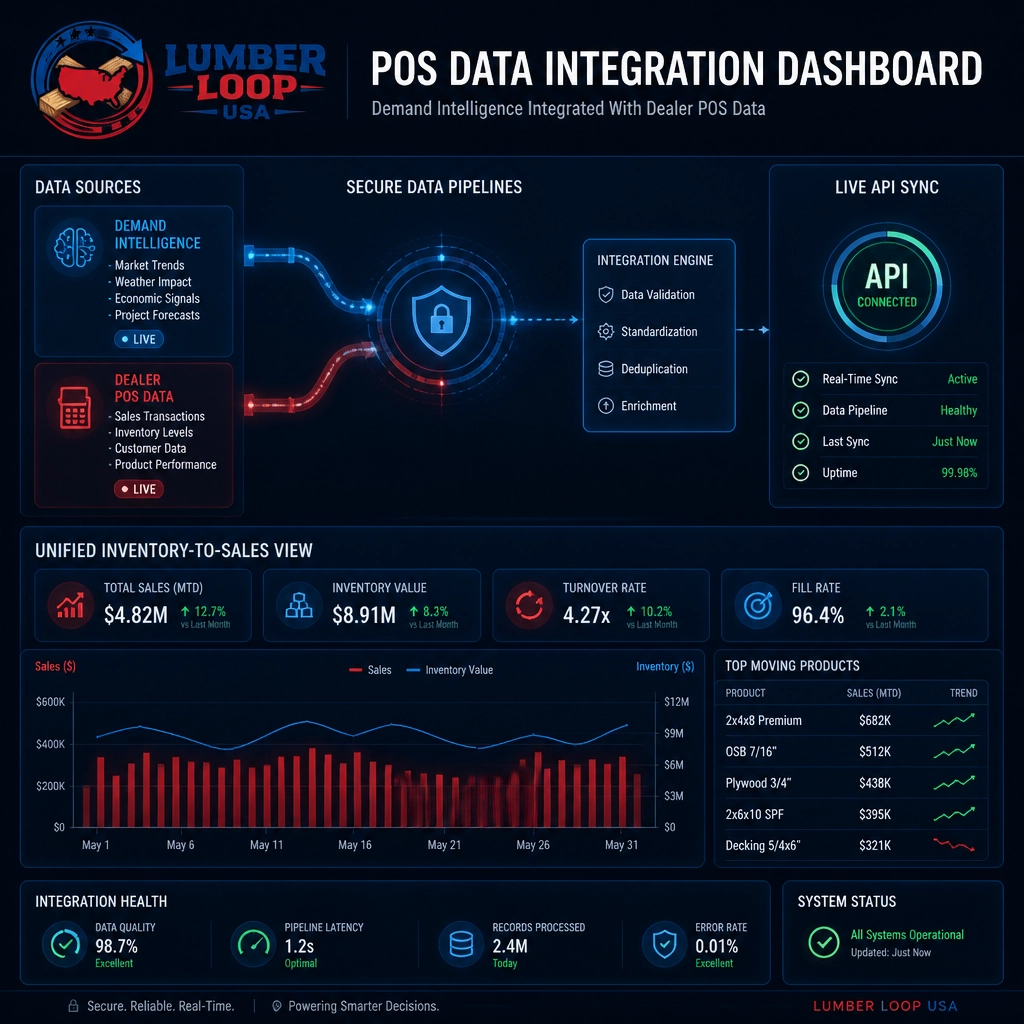
The next step is connecting demand intelligence with dealer POS data, opportunity tracking, inventory signals, and dealer performance metrics. This creates a measurable dealer network, one where you can understand not only where demand exists, but what happens after demand reaches a partner.
The Revenue Problem Hidden Inside a Basic Dealer Locator
A traditional dealer locator typically performs one function: it helps a buyer find a nearby location.
That function remains useful. The problem begins when the locator is treated as a complete channel analytics solution.
A static locator generally does not show whether a dealer:
- Responded to the buyer
- Had the requested product in stock
- Provided pricing or a quote
- Won or lost the opportunity
- Recommended a substitute product
- Followed up within an acceptable response time
- Converted the opportunity into a documented sale
This creates a blind handoff. Marketing can report traffic and locator activity, while sales may see dealer orders weeks later, if the transaction is captured in a way that can be connected back to the original demand signal.
The result is fragmented manufacturer ROI tracking. You may know that demand was generated, but not whether it produced channel revenue.
That missing connection can affect decisions across marketing, sales, distribution, and product strategy:
- Marketing cannot confidently attribute revenue to campaigns or regional programs.
- Sales leaders cannot compare dealer response rates or win rates.
- Channel teams cannot identify where opportunities are being lost.
- Supply chain leaders cannot distinguish weak demand from poor availability.
- Executives cannot see where regional market potential exceeds actual sell-through.
The issue is not the locator itself. The issue is what the locator fails to measure.
Move From Dealer Discovery to Dealer Network Visibility
Dealer network visibility begins when you connect the demand signal to the channel outcome.
For example, a manufacturer may see a high volume of product interest in a specific region. That demand can be compared with:
- Dealer response times
- Quote completion rates
- Product availability
- Inventory levels
- Substitution activity
- Win and loss status
- POS sell-through
- Regional sales performance
This turns a directory of dealer locations into an intelligence layer for the channel.

With this model, a low-sales region no longer tells only one story. It may indicate limited market demand, but it may also reveal slow dealer follow-up, weak inventory positioning, poor product representation, or missed opportunities after a buyer was referred.
That distinction matters.
Without dealer network visibility, manufacturers often respond to underperformance by increasing marketing activity or adding more channel partners. With visibility, you can first determine whether existing demand is being answered and converted.
The Data Model: Connect Demand, Activity, and Sell-Through
Integrating demand intelligence with dealer POS data does not mean simply placing two reports next to each other. The value comes from creating a shared data model that connects activity across the customer and channel journey.
At a minimum, the integration should align four dimensions:
1. Product
Map manufacturer SKUs, dealer item numbers, product families, sizes, finishes, and equivalent products into a consistent product hierarchy.
This is especially important when dealer systems use different product descriptions, units of measure, or local item codes. Without product normalization, your building material sales analytics may compare unrelated items or miss substitutions that affect market share.
2. Location
Standardize dealer branches, ZIP codes, territories, metros, counties, and sales regions.
A demand signal should be attributable to the area it represents, while POS data should identify the branch or dealer responsible for the sale. This allows you to compare regional opportunity with actual sell-through.
3. Time
Align lead activity, quote timestamps, inventory snapshots, orders, shipments, and POS transactions.
Time-based analysis helps reveal whether a slow response preceded a lost opportunity, whether a stock-out coincided with demand, or whether a marketing campaign created sales activity within the expected window.
4. Opportunity status
Capture what happened after the handoff.
Useful statuses include:
- Referred
- Viewed
- Contacted
- Quoted
- Won
- Lost
- Substituted
- Abandoned
- Unresolved
POS data can confirm sell-through, but it may not explain every lost opportunity. That is why POS integration should be paired with opportunity tracking and dealer response data.
Use POS Data to Validate What Demand Intelligence Predicts
Demand intelligence shows where interest and market opportunity are developing. Dealer POS data shows what moved through the channel.
Together, they provide a more complete view of performance.
Consider three possible scenarios:
High demand, low POS sell-through
This may indicate:
- Poor dealer follow-up
- Product availability issues
- Competitive substitution
- Pricing friction
- Inaccurate dealer information
- Demand being routed outside the preferred network
This is a potential leakage signal, not proof of a single cause. Your channel team can investigate the underlying activity rather than assuming the market is weak.
Low demand, high POS sell-through
This may indicate that the manufacturer’s demand-capture systems are underreporting activity, that buyers are entering through offline channels, or that the dealer has strong existing relationships not visible in digital demand data.
This is an opportunity to improve attribution and understand how the dealer is generating business.
High demand, high POS sell-through
This is where you can identify repeatable growth patterns. Compare the region, product category, dealer response time, inventory position, campaign source, and quote win rate to determine what is contributing to performance.
This is the foundation of scalable manufacturer channel analytics.
Measure Dealer Performance Beyond Revenue
Revenue remains important, but it is a lagging indicator. To improve channel performance, manufacturers need leading indicators that show where opportunities are progressing or stalling.
A connected dashboard should help you monitor:
- Lead response time by dealer and region
- Percentage of referred opportunities receiving a response
- Quote completion rate
- Quote win rate
- Lost and abandoned opportunity volume
- Substitution rate
- Product availability at the time of demand
- POS sell-through by product and branch
- Inventory coverage and stock-out frequency
- Demand-to-sales conversion by region
- Campaign-sourced opportunity and revenue
- Dealer performance relative to local demand potential

These metrics give sales and marketing leaders a shared operating view. Marketing can see whether demand converts after it is routed. Sales can identify dealers that consistently respond and win. Channel leadership can focus support where performance is below potential.
Most importantly, you can separate a demand-generation problem from a channel-execution problem.
Improve Manufacturer ROI Tracking
Manufacturers invest in campaigns, product launches, dealer programs, search visibility, events, and market development funds. If the measurement stops at a click or dealer-locator visit, the ROI story is incomplete.
A stronger measurement framework connects:
- Demand source
- Product interest
- Geographic market
- Dealer referral
- Response and quote activity
- Opportunity outcome
- Dealer POS sell-through
This creates a path from marketing activity to channel performance.
You can then ask more valuable questions:
- Which campaigns generate opportunities that dealers actually win?
- Which regions show strong demand but weak sell-through?
- Which dealers convert referred demand most effectively?
- Where are buyers being substituted into competing products?
- Which product categories have the greatest gap between market interest and sales?
- Where should channel investment increase, or be redirected?

The goal is not to claim that every lead will become a sale. The goal is to understand the outcomes well enough to improve decisions, allocate resources, and identify preventable leakage.
A Practical Integration Path
You do not need to replace your entire technology stack to begin.
A practical approach is to build an intelligence layer around the systems you already use:
Start with priority dealers and regions
Begin with a representative group of dealers, branches, or product categories. Focus on areas where demand is meaningful but channel performance is unclear.
Establish data standards
Define the product, location, time, and opportunity fields required for consistent reporting. Resolve SKU and branch mapping issues early.
Connect the key data sources
Bring together demand signals, dealer referrals, response activity, quote outcomes, inventory data, POS transactions, and manufacturer sales data.
Create shared performance views
Give marketing, sales, and channel leaders access to the same definitions for response time, win rate, sell-through, and attribution.
Add alerts and opportunity tracking
Surface exceptions such as high demand with low inventory, repeated slow responses, or strong regional potential with weak dealer conversion.
Expand based on measurable value
Once the model demonstrates clearer visibility in priority areas, extend it across additional dealers, regions, and product lines.
The Strategic Question to Ask Next
Your dealer locator may be generating valuable demand. But can you see what happens after a buyer finds a dealer?
If the answer is no, your manufacturer ROI tracking is likely stopping too early.
A static locator tells buyers where to go. An intelligent, measurable dealer network helps you understand whether demand was answered, quoted, won, lost, substituted, or abandoned: and how those outcomes connect to POS sell-through and regional performance.
Lumber Loop helps manufacturers connect demand intelligence, dealer activity, and channel outcomes so they can measure what happens after the handoff.
The most important revenue insight may not be the demand you can see. It may be the demand you currently cannot follow.
Get matched with local dealers in minutes.
Submit your material needs and ZIP — we'll route to the closest qualified dealers in your market.
Request a QuoteMore insights
Lead Leakage Is Costing You More Than You Think: Why a CRM Alone Cannot See the Full Buyer Journey
Win-Rate Analytics for Manufacturers: Finding the Dealers Who Actually Close Your Demand