Territory Blind Spots: Where Your Demand Is Being Filled by Someone Else's Product
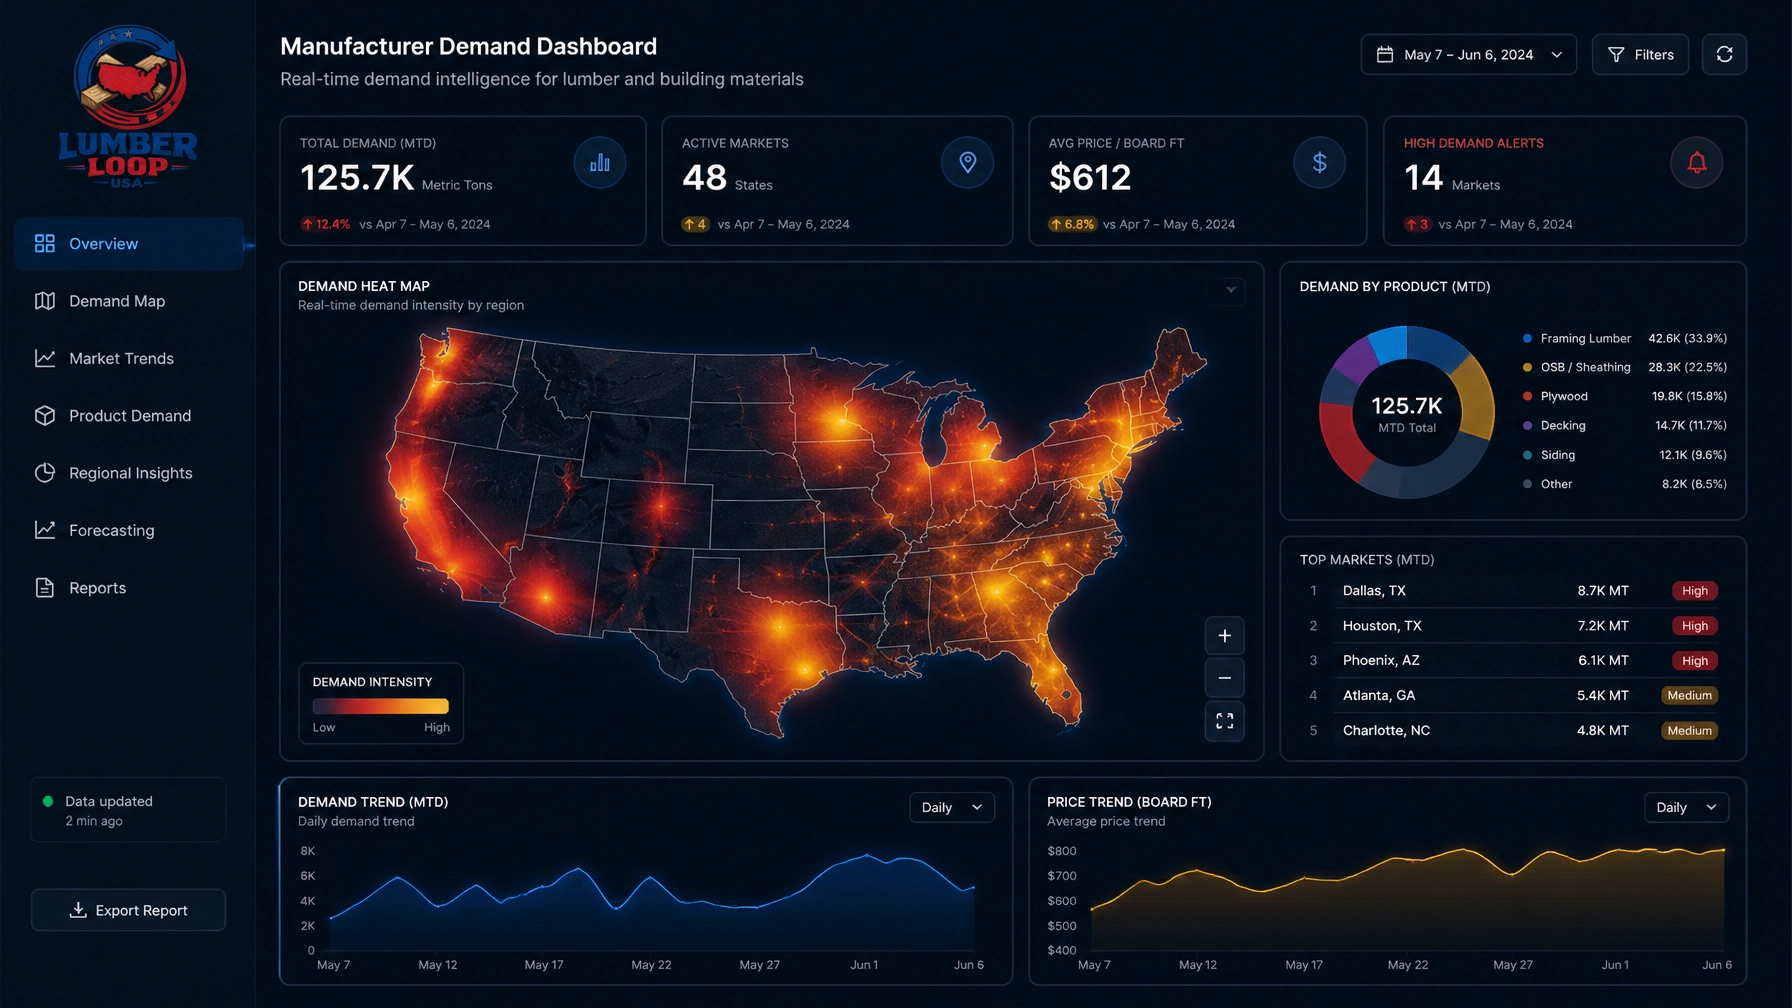
A territory can look strong on a demand heat map and still be a market your brand is losing.
The map may show concentrated interest in your product category. But geographic demand volume alone cannot tell you whether buyers are choosing your product, whether local dealers are representing it effectively, or whether the resulting sale is going to a competing brand.
That distinction matters. Demand in a territory is not the same as demand captured by your brand.
If you can see activity by ZIP code but cannot see outcomes by product, dealer, or branch, you may be looking at opportunity while a competitor captures the sale. A territory you can’t see inside is a territory you’re sharing with your competitor by default.
A Demand Heat Map Shows Where to Investigate, not What You’ve Won
A heat map is useful for identifying where interest is concentrated. It is not, by itself, a measure of market share, product preference, or channel effectiveness.
Two territories with similar demand volume can have very different commercial realities:
- In one, dealers stock your product, respond consistently, and convert interest into sales.
- In another, a dealer receives the same demand but quotes a competing line, lacks your product, or leaves opportunities unresolved.
If you compare only territory totals, those outcomes can appear identical. The demand is visible; the brand-level result is not.
To understand what a territory is actually delivering, connect demand signals to product-level and branch-level outcomes. That means looking beyond where interest occurs to see what happens after it reaches the channel.

Strong Market, Weak Representation, or Simply Weak Demand?
A low sales total can mean different things. The market may have limited demand, or your brand may lack the coverage, availability, or dealer execution needed to capture demand that already exists.
Those situations call for different decisions.
Weak demand
Demand signals and brand sales are both low. Before investing, assess whether the market has potential, whether your product fits local needs, and whether awareness or demand creation is warranted.
Strong demand, weak representation
Interest in the category is high, but your product-level sales remain low. This may indicate:
- Inadequate dealer or branch coverage
- Limited availability of your product
- Slow dealer response or incomplete quoting
- Frequent substitution to another brand
- A product mix that gives the dealer stronger incentives or easier access to competing lines
Without outcome data, it is easy to mistake weak representation for a weak market, and to respond by spending more on demand creation when the channel needs attention.
How a Dealer Can Turn Your Demand Into a Competitor’s Sale
A dealer that carries competing lines can serve a buyer’s need while steering the sale elsewhere. That may happen because your product is unavailable, because the competing product is easier to quote, or because the dealer’s assortment and sales practices favor another brand.
From a territory-total perspective, the buyer was served. The dealer may record a sale. But unless the result is tied to the requested product and the dealer or branch that handled the opportunity, your organization may never see the substitution.
This is why substitution rate needs a clear definition. For example, you might measure substitutions as the number of eligible opportunities where your product was replaced by a competing brand, divided by the total eligible opportunities. The denominator and the reasons for substitution should be consistent across teams and reporting periods.
Useful reasons to track include:
- Product out of stock or unavailable
- Lead time or delivery concern
- Price or commercial terms
- Product specification mismatch
- Dealer recommendation or preference
- Buyer-selected alternative
- Outcome unknown
Not every substitution is preventable, and not every competitor sale signals a channel failure. The value is in identifying patterns by product, dealer, branch, and territory, then investigating the causes rather than relying on assumptions.
Build a Territory View That Connects Demand to Outcomes
A practical blind-spot review starts by comparing demand signals in each ZIP code or territory with downstream results. Use the most consistent data available, and make gaps in reporting visible rather than treating missing data as a successful outcome.
Compare demand against:
- Product-level sell-through: Units or transactions by SKU or product family, dealer, and branch, where available.
- Dealer response time: How long it takes a partner to respond to a routed opportunity.
- Quote completion: Whether demand progresses to a quote, not just a referral or initial contact.
- Substitution rate: How often your product is replaced, with reasons captured consistently.
- Win rate: Won opportunities divided by closed opportunities, segmented by product and location.
- Coverage: Which dealers and branches can serve the territory and carry the relevant product range.
- Inventory and availability: Whether the product could be supplied when demand emerged.
Shipment data alone is not a substitute for sell-through. Shipments show product moving into the channel; sell-through shows whether it moved through to the market. When you have both, you can better distinguish stock sitting in the network from product being selected and sold.

Flag Territories Where Interest and Brand Sales Diverge
The most important territories to investigate are not always the ones with the highest or lowest sales. Look for mismatches between the demand signal and your brand’s outcome.
Flag territories where:
- Category or product interest is strong but brand-level sales are low.
- Demand is concentrated around branches that do not carry the relevant product.
- A single dealer accounts for most of the local coverage.
- One dealer receives demand but has slow response times or low quote completion.
- A product’s demand is present, but its sell-through is weak compared with related products.
- Substitution rates are elevated for a specific product, branch, or dealer.
- Strong sell-in is not reflected in downstream sell-through.
A mismatch is a prompt to investigate, not a verdict on the dealer. Context matters: local product mix, stocking capacity, seasonal demand, and data completeness can all affect results. Normalize comparisons where possible and make clear when outcomes are unknown.
Let the Evidence Drive the Territory Decision
Once you identify a blind spot, match the response to the likely cause. More marketing is not always the answer, and adding another dealer is not always the right fix.
Depending on what the product- and branch-level data shows, you may decide to:
- Add or reallocate dealer coverage where demand is present but qualified representation is limited.
- Change routing when opportunities are consistently sent to a branch that cannot serve the product or market.
- Reposition inventory where demand and product availability are misaligned.
- Invest in product education when the product is available but dealer knowledge or confidence may be affecting recommendations.
- Enable specific branches with focused support when performance varies within the same dealer network.
- Redirect marketing spend toward a market with demonstrated demand but a solvable coverage or conversion gap.
This is where territory analytics becomes a planning tool. You can use it to focus investment on the actual constraint (coverage, routing, availability, dealer execution, or demand creation) instead of treating every underperforming territory the same way.
Demand Intelligence Complements Your CRM
Your CRM remains important for managing known accounts, contacts, and opportunities. But territory blind spots can exist before an opportunity enters the CRM or after a dealer receives it.
Demand intelligence adds a visibility layer across market signals, dealer handoffs, product-level outcomes, and channel performance. Connected to CRM and sell-through data where available, it helps you ask a broader set of questions:
- Where is demand emerging by ZIP code and product?
- Which dealer or branch received it?
- Was the product quoted, substituted, or left unresolved?
- Did brand-level sell-through follow the demand signal?
- What changed in the market or channel before the outcome?
That visibility helps you distinguish a market that needs demand creation from one that already has demand but lacks effective representation.

Make Territory Decisions at the Level Where Sales Happen
Territory totals can tell you where to look. Product-level and branch-level outcomes help you understand what is happening there.
When you compare local demand with dealer response times, quote completion, substitution rates, win rates, and sell-through, a high-demand, low-sales territory becomes diagnosable. You can identify coverage gaps, single-dealer dependencies, and product mixes that make substitution more likely. Then you can decide whether the market needs new coverage, better routing, more appropriate inventory, branch-level enablement, or a different marketing investment.
The core point is simple: a territory you can’t see inside is a territory you’re sharing with your competitor by default. Visibility at the product and dealer level is what helps close that gap.
Continue the series: The Hidden Cost of the Dealer Handoff, Win-Rate Analytics for Manufacturers, and Lead Leakage Is Costing You More Than You Think. You can also revisit how heat maps inform territory decisions.
Find the Blind Spots in Your Channel
Before you expand coverage or increase marketing spend, identify where demand is going, and whether your brand is capturing it.
The Free Lead Leakage Scorecard can help you assess the visibility gaps between demand creation, dealer handoff, opportunity tracking, and channel outcomes.
Get matched with local dealers in minutes.
Submit your material needs and ZIP — we'll route to the closest qualified dealers in your market.
Request a QuoteMore insights
Heat Maps Don't Close Deals: Turning Demand Data Into Territory Decisions

Anonymous Demand: The Buyers Shopping Your Catalog Who Never Reach Your CRM